Trucking Risk Assessment Guide for Fleet Managers
- Guyorguy Laguerre
- Jun 3
- 9 min read


TL;DR:
A trucking risk assessment systematically evaluates safety, compliance, operational, and financial exposures to improve fleet safety and reduce insurance costs. Utilizing FMCSA BASIC scores, telematics, and hazard data allows fleets to prioritize risks, implement controls, and negotiate better coverage. Ongoing documentation, technology, and regular reviews are essential to maintain operational controls and support insurance and regulatory success.
A trucking risk assessment is a systematic evaluation of the operational, safety, compliance, and financial exposures that can disrupt your fleet, trigger regulatory action, or inflate your insurance premiums. Fleet managers who follow a structured trucking risk assessment guide consistently achieve better safety outcomes, lower claim frequencies, and stronger positions when negotiating coverage with insurers. The FMCSA Safety Measurement System (SMS), telematics technology, and driver behavior data are the three pillars that make modern risk assessment both measurable and repeatable. This guide walks you through every stage of that process, from identifying core risks to scoring them, managing FMCSA BASIC scores, and deploying technology that translates into real premium savings.
What is a trucking risk assessment guide and why does it matter?
A trucking risk assessment guide is the structured framework fleet managers use to identify, score, and control the exposures that threaten safety, compliance, and profitability. Without it, risk management defaults to reactive firefighting. With it, you make decisions based on data rather than instinct.
The connection between assessment quality and financial outcomes is direct. Usage-based insurance and telematics programs can reduce premiums by 10 to 20% for fleets demonstrating safe driving, while a single at-fault accident within three years can increase premiums by 25 to 40%. That spread represents tens of thousands of dollars annually for a mid-size fleet. A disciplined assessment process is what separates fleets that capture the discount from those absorbing the surcharge.
The standard industry term for this discipline is fleet risk management. The trucking risk assessment guide is the entry point. It produces the data that feeds every downstream decision, from driver coaching to insurance negotiations to capital allocation for maintenance.
What are the core risks trucking fleets face?
Collisions driven by unsafe driving behaviors such as speeding and distraction represent the single largest liability category for most fleets. Regulatory risks follow closely, including hours-of-service violations and vehicle maintenance failures that lead to fines, out-of-service orders, and safety rating damage. Understanding these categories is the foundation of any freight transport risk guide.
The major risk categories every fleet must assess include:
Safety risks: Driver distraction, fatigue, speeding, and impairment. These generate the most severe claims and the highest FMCSA Unsafe Driving BASIC scores.
Compliance risks: HOS violations, incomplete driver qualification files, failed drug and alcohol testing protocols, and vehicle inspection failures. FMCSA out-of-service criteria can ground vehicles immediately, disrupting revenue.
Operational risks: Unplanned downtime from mechanical failure, route hazards, cargo securement failures, and weather exposure. For full truckload freight operations, a single breakdown on a time-sensitive lane can cascade into customer penalties.
Financial risks: Rising repair costs, fuel price volatility, cargo theft, and the compounding effect of insurance premium increases after claims.
Reputational risks: Public crash records, CSA score visibility to shippers and brokers, and social media exposure after serious incidents.
Data sources for identifying these risks include crash history reports, CSA scores from the FMCSA SMS portal, roadside inspection records, driver qualification files, and telematics data. Geographic factors also shape risk profiles. A fleet running mountain corridors in winter faces different severity distributions than one operating urban last-mile routes. Your logistics risk analysis must reflect the actual lanes and cargo types your drivers operate, not a generic industry average.
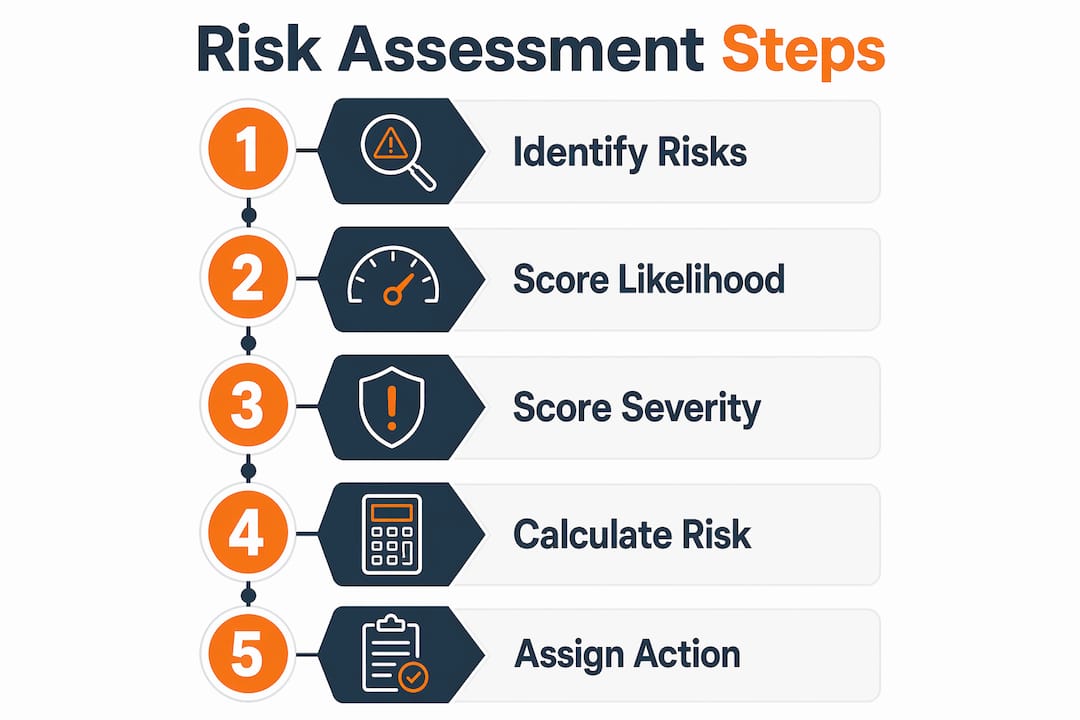
How do you build a trucking risk assessment matrix?

A risk matrix converts qualitative observations into scored, prioritized data that you can act on and track over time. Fleet risk management best practices recommend scoring both likelihood and severity on a 1 to 5 scale, then multiplying the two scores to produce a risk score between 1 and 25.
The resulting risk bands give you a clear action hierarchy:
Risk Band | Score Range | Required Action |
Critical | 15 to 25 | Immediate intervention, assign senior owner, weekly review |
High priority | 8 to 14 | Corrective plan within 30 days, monthly tracking |
Monitor | 1 to 7 | Document controls, quarterly review |
To build the matrix, start by listing every identified risk from your data sources. For each risk, score likelihood based on frequency data from your own fleet records and industry benchmarks. Score severity based on the worst credible outcome, factoring in potential injury, regulatory penalty, and insurance impact. Multiply the two scores and place each risk in the appropriate band.
The next step is mapping each risk to your existing controls. A driver distraction risk might already have a dashcam policy and a phone-use prohibition. The question is whether those controls are actually enforced. The gap between written policy and operational reality is where most fleets accumulate their highest-scoring risks. Assigning an owner per risk and documenting current controls forces that gap into the open.
Review cadence matters as much as the initial scoring. A risk matrix that gets updated once a year is a compliance document. One that gets reviewed monthly becomes a management tool. Assign each critical and high-priority risk to a named individual, set a review date, and track whether scores are improving or deteriorating over time.
Pro Tip: Fleet managers consistently underestimate likelihood scores for risks that have not yet produced a claim. If a behavior is occurring regularly, such as drivers exceeding speed limits on a specific corridor, the likelihood score should reflect observed frequency, not the absence of a prior incident.
How do FMCSA BASIC scores affect your risk profile?
FMCSA’s Safety Measurement System uses percentile-based BASIC scores from 0 to 100 to represent relative safety performance compared to peer carriers. Higher percentiles indicate worse performance and greater intervention risk. The six BASIC categories are Unsafe Driving, Hours-of-Service Compliance, Driver Fitness, Controlled Substances and Alcohol, Vehicle Maintenance, and Crash Indicator.
FMCSA intervention thresholds vary by category. Unsafe Driving, HOS Compliance, and Crash Indicator trigger enforcement attention at the 65th percentile. Vehicle Maintenance, Driver Fitness, and Controlled Substances and Alcohol trigger at the 80th percentile. Crossing these thresholds can initiate warning letters, off-site investigations, or full compliance reviews.
Several nuances are critical for accurate commercial vehicle risk assessment:
Time-weighting: Newer violations carry more weight while older ones diminish over time. This means recent corrective actions improve scores faster than waiting for old violations to age out.
Severity-weighting: Not all violations count equally. A driver placed out of service for a HOS violation scores higher than a minor equipment defect.
Peer group benchmarking: Scores reflect performance relative to carriers with similar operations, not an absolute standard. A score of 60 in Vehicle Maintenance means 60% of comparable carriers performed better.
BASIC scores are not safety ratings: The official safety rating (Satisfactory, Conditional, or Unsatisfactory) comes from a formal compliance review, not from SMS percentiles.
“Don’t over-interpret BASIC percentiles; they are ranking tools to prioritize enforcement, not definitive safety ratings.” — CSA Scores Explained
For insurance purposes, BASIC scores function as a proxy for risk quality. Brokers and underwriters review SMS data before quoting. A fleet with multiple categories above intervention thresholds will face higher premiums and fewer carrier options. Managing scores is therefore both a regulatory obligation and an insurance strategy. The two are inseparable in a well-executed trucking safety assessment.
What tools and tactics reduce trucking risk most effectively?
Risk treatment in trucking operates across four pillars: safety, compliance, maintenance, and insurance integration. Effective risk management in trucking requires all four working together, not independently.
Follow these steps to build a risk mitigation program that insurers and regulators will recognize:
Deploy AI dashcams and telematics. AI dashcams from providers like Samsara, Motive, and Lytx detect distraction, following distance violations, and hard braking in real time. Telematics platforms provide the speed, location, and idling data that feeds both your risk matrix and your BASIC score management. Technology alone does not reduce risk; it must enable coaching conversations and enforcement actions to produce results.
Implement electronic logging devices. ELD compliance eliminates HOS falsification risk and produces the audit trail that demonstrates regulatory control to both FMCSA and insurers. Demonstrating ELD compliance to underwriters is one of the most direct ways to translate DOT exposure into documented risk mitigation.
Run a behavior-based safety program. Score drivers monthly on telematics data, conduct structured coaching sessions for drivers in the bottom quartile, and document every intervention. This creates the paper trail that supports both FMCSA compliance reviews and insurance underwriting conversations.
Establish preventive maintenance schedules. Vehicle Maintenance is one of the most common BASIC categories above intervention thresholds. Preventive maintenance software from platforms like Fleetio or Whip Around tracks inspection intervals, defect reports, and repair completion. Proactive maintenance reduces both out-of-service risk and the frequency of roadside inspection violations.
Preserve accident evidence immediately. After any collision, secure dashcam footage, driver logs, inspection records, and witness information within 24 hours. Evidence preservation directly affects claim outcomes and supports the narrative that your fleet operates controlled processes.
Integrate usage-based insurance programs. Telematics programs can reduce premiums by 10 to 20% for fleets demonstrating safe driving. Enrolling in a usage-based program also creates a feedback loop between safety performance and insurance cost, which motivates sustained driver behavior improvement. Understanding trucking insurance premiums and how risk factors influence them helps fleet managers make the case internally for safety investment.
Pro Tip: Maintain driver qualification files in a centralized, export-ready format. FMCSA new entrant safety audits occur within 12 months of receiving operating authority and examine driver files, drug testing records, HOS logs, maintenance records, and insurance documentation. Disorganized files are the most common reason fleets fail audits they should pass.
Continuous monitoring ties the program together. Track accident rates per million miles, CSA score trends by BASIC category, roadside inspection pass rates, and compliance violation counts monthly. These indicators tell you whether your risk matrix scores are moving in the right direction and where to focus coaching resources next.
Key takeaways
A structured trucking risk assessment, anchored in FMCSA BASIC score management and telematics data, is the most direct path to lower insurance premiums and fewer regulatory interventions.
Point | Details |
Score every risk on a 1 to 25 scale | Multiply likelihood and severity scores to prioritize critical risks and assign named owners. |
BASIC scores drive insurance outcomes | Scores above intervention thresholds signal higher risk to underwriters and reduce coverage options. |
Telematics requires human follow-through | AI dashcams and ELDs only reduce risk when paired with structured driver coaching and enforcement. |
Time-weighting accelerates score recovery | Recent corrective actions improve BASIC scores faster than waiting for old violations to age out. |
Organized compliance files prevent audit failures | Driver qualification files and maintenance records must be export-ready before FMCSA contact occurs. |
What I’ve learned from watching fleets get risk assessment wrong
Most fleet managers I’ve worked with understand the theory of risk assessment. They know what a risk matrix is. They know BASIC scores matter. Where things break down is in the gap between documentation and operational reality, and that gap is almost always a culture problem, not a technology problem.
I’ve seen fleets with best-in-class telematics platforms and dashcams on every truck still accumulate deteriorating BASIC scores because no one was actually reviewing the coaching alerts. The data was there. The interventions never happened. DOT compliance treated as systemic safety controls, rather than isolated paperwork, is what separates fleets that sustain improvement from those that cycle through the same violations year after year.
The other pattern I see consistently is over-reliance on BASIC percentiles as a final verdict. A fleet at the 64th percentile in Unsafe Driving is not “safe.” It is one bad month away from crossing the intervention threshold. The percentile system ranks you against peers, many of whom are also operating with significant risk exposure. Use the scores as a directional signal, not a report card.
The fleets that negotiate the best liability coverage terms are the ones that walk into underwriting conversations with documented evidence of operational controls, not just clean scores. Insurers want to see that your safety program will sustain performance through driver turnover, seasonal demand spikes, and equipment aging. That story is told through process documentation, not just numbers.
— Guyorguy
How Insuaria helps fleet managers organize their insurance review
Insuaria is a compliance-first insurance intake and referral platform built to simplify the first step of the insurance review process for trucking businesses and fleet operators. Before a licensed insurance professional can evaluate your coverage needs, they need organized, accurate information about your fleet, your operations, and your risk profile. Insuaria’s intake forms are designed to capture exactly that, covering trucking operations, driver records, vehicle details, and compliance history in a structured format that licensed agency partners can act on efficiently. If your risk assessment work has surfaced gaps in your current coverage or you are preparing for a renewal conversation, start your business insurance intake with Insuaria to get the process moving in the right direction.
FAQ
What is a trucking risk assessment?
A trucking risk assessment is a systematic process for identifying, scoring, and prioritizing the safety, compliance, operational, and financial risks that affect a fleet’s performance and insurance costs. It typically uses a likelihood-by-severity scoring matrix to rank risks from 1 to 25 and assign ownership for corrective action.
How do FMCSA BASIC scores affect insurance premiums?
BASIC scores above intervention thresholds signal elevated risk to insurance underwriters, which reduces carrier options and increases premiums. Fleets that demonstrate controlled operations through telematics and driver coaching programs can offset score-related premium pressure.
How often should a fleet update its risk assessment?
Critical and high-priority risks should be reviewed monthly, with a full risk matrix update at least quarterly. BASIC scores update monthly in the FMCSA SMS portal, so score-linked risks warrant the same review frequency.
What technology tools are most effective for trucking risk mitigation?
AI dashcams from providers like Samsara, Motive, and Lytx, combined with ELDs and preventive maintenance platforms like Fleetio, address the highest-frequency risk categories. Their value depends entirely on whether the data they generate triggers consistent coaching and enforcement actions.
What documents should a fleet have ready for an FMCSA audit?
Driver qualification files, drug and alcohol testing records, HOS logs, vehicle maintenance records, and proof of insurance are the core documents FMCSA examines during new entrant safety audits and compliance reviews. Organizing these in an export-ready format before any audit contact is the single most effective audit preparation step.
Recommended
Comments